Detailed information on journal subscription costs paid to individual publishers by the Finnish research institutions has been released by the Finnish Ministry of Education and Culture, and its Open Science and Research Initiative funded 2014–2017 (Academic Publishing Costs in Finland 2010–2015).
With this, Finland becomes to our knowledge the first country where annual subscription fees for all individual publishers and all major research institutions have been made available, spanning the years 2010-2015. Similar information has been previously released for some, but not all publishers and research institutions in the UK and US; and related activities are ongoing in several countries (see the recent blog post by Stuart Lawson).
Access to literature is fundamental to academic research but this has been challenged with the rapidly increasing prices of academic journals, which university libraries find increasingly difficult to fund. According to the data from the US Association of Research Libraries the academic journal subscription charges increased 4x faster than inflation in 1986-2007. The relative variation in prices is also considerable among the publishers (Bergstrom et al. PNAS 2014). Limited access to detailed pricing information and agreement details are likely to result in suboptimal contracts (Cockerill, 2006; Shieber, 2009). Improved access to subscription costs can hence be expected to lead to better deals and lower costs for the universities. It can also facilitate transition to the Open Access (OA) publishing model.
Motivated by all this, and following Tim Gowers successful FOI request on the subscription costs for scientific journals in UK, we made a similar request in Finland together with the Open Knowledge Finland association and other Open Science advocates. After the Finnish universities turned down my FOI request in summer 2014, we appealed in court, which decided the case positive for us in August 2015. For an English summary of this process, see a separate post in the MostlyPhysics blog.
Here I provide a brief preliminary analysis of the data on journal subscription fees that was collected and released by the Ministry of Education Open Science Initiative in Finland. I have abbreviated some terms as detailed in the source code of this analysis is maintained in Github.
Overall subscription costs 2010-2015
Finland paid in total 131.1 million EUR subscription and other fees on scientific publishing in 2010-2015. The overall breakup of the costs is available as a separate table. The average annual costs for in Finland were 22 MEUR in 2010-2015; this is one third of the annual subscription costs in Austria (70 MEUR; Bauer et al., 2015), and two thirds of the annual expenditure (31 MEUR) in New Zealand. Data for the top-10 publishers in the UK 2010-2014 is available in Lawson, Meghreblian & Brook, 2015 (Table 1). During this period the UK paid altogether 4319 MEUR (rough estimate based on the exchange rate June 12, 2016) for the top-10 publishers. Finland paid 61 MEUR for the same top-10 publishers in the same period, which is roughly 17% of the UK expenditure per capita (unexpectedly low?). The costs in the other countries seem unexpectedly high compared to Finland, I wonder what is the explanation. Either Finland can negotiate considerably better deals, or, perhaps more likely, the figures from the different countries are not directly comparable but this will require further investigation.
The data set covers all Finnish universities, major public institutions, and a number of special libraries, information services and other smaller institutions. Open access article processing charges (APCs) are not included in this data collection as far as I can see, although it would be interesting in its own right. It was recently reported by Naukkarinen (2016) that in 2014 18% of the articles in Finnish universities were published as open access. It was also estimated that publishing all articles as Open Access would have cost 17 MEUR, whereas the subscription fees in 2014 were 22 MEUR. This suggests that the transition to the Open Access model might be a good idea. Overall, there are roughly 35 000 peer-reviewed academic journals globally (Ware & Mabe, 2015); less than a third of these (11 000) are open access (DOAJ, 2016). A common complaint regarding the (golden) OA model is the relatively high cost of the article processing charges, typically paid from primary research funding. With this funding model, money going OA is frequently seen as being taken away from other research activities, such as experiments or research personnell. In contrast, publication costs in the conventional subscription model are funded through university libraries with secret discloure agreements with the publishers and hence largely masked from the research community. In order to assess the true costs of scientific publishing and in order to facilitate shift to OA, the costs of the subscription model must be made more transparent and money used for conventional subscription must be diverted to funding the costs of OA publishing.
The full data set details the subscription fees also by agreement type, organization type, and subscription category.
Costs by publisher
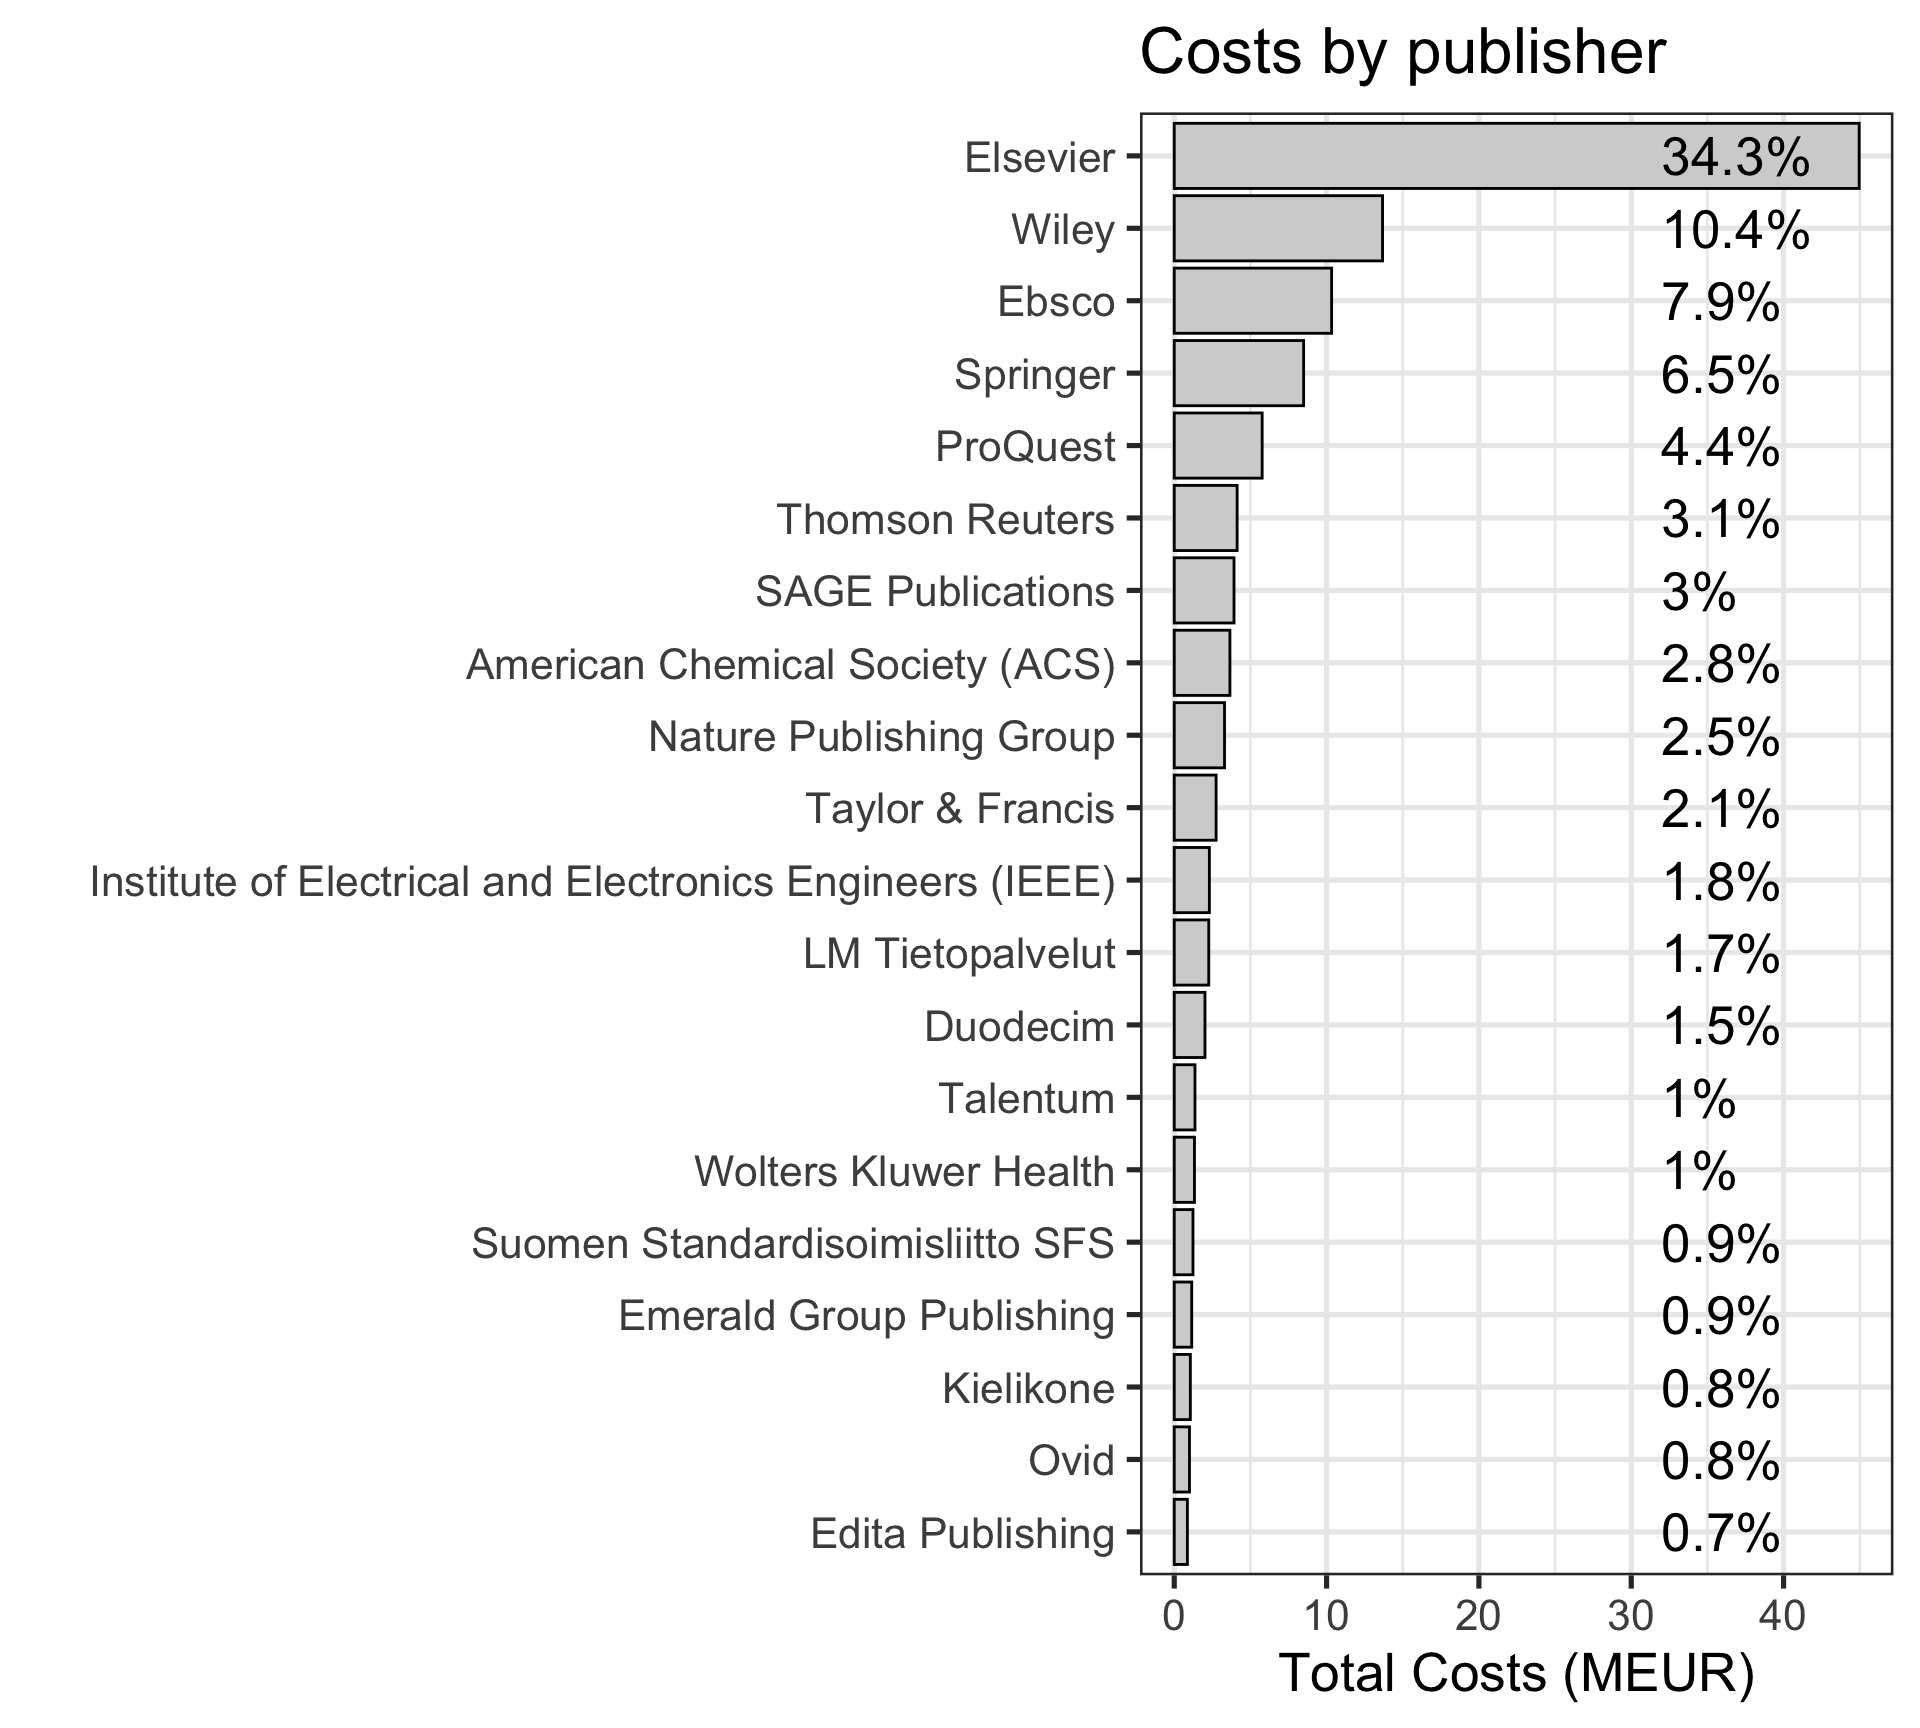
The Finnish data covers 244 individual publishers (see annual costs by publisher). The figure indicates the total subscription fees paid to the top publishers 2010-2015. Over one third of the total costs go to Elsevier, which has been often criticized for its huge profit margins. The costs are given per bundle, so we cannot compare individual publishers on a per article or per citation basis based on this data set. It was recently estimated elsewhere, however, that Elsevier’s prices per citation are roughly 3x higher than with non-profit publishers; Emerald, Sage, and Taylor & Francis had roughly 10x higher prices (Bergstrom et al. PNAS 2014).
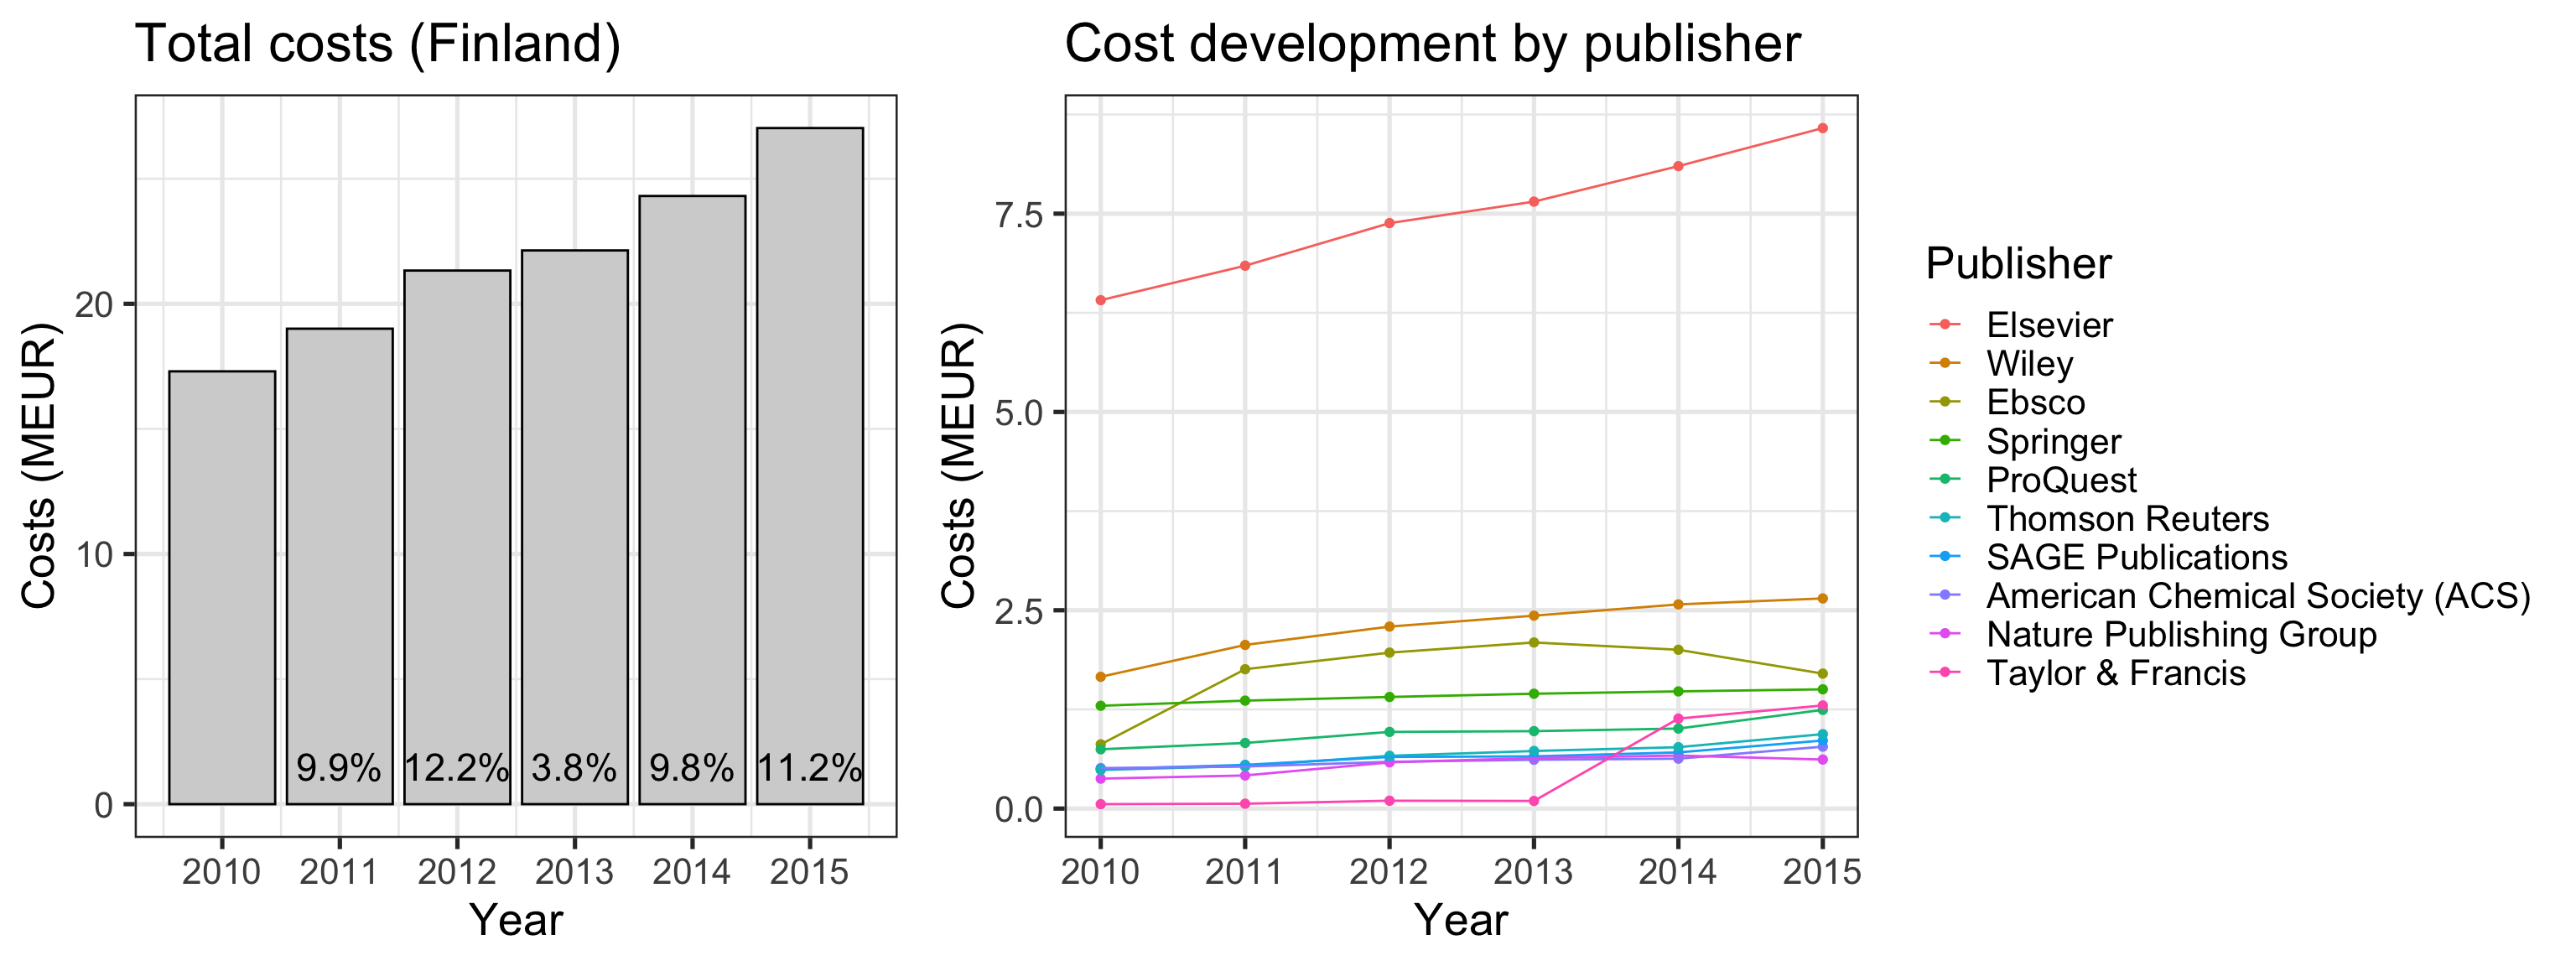
The total costs paid to scientific publishers by Finland have increased roughly 10% per year in 2010-2015 (annual increase is indicated in the left figure). The top-10 publishers correspond to 77% of the overall costs (right figure). See a separate table for full annual costs by publisher (the top-10 publishers shown below).
| Publisher (costs in MEUR) | 2010 | 2011 | 2012 | 2013 | 2014 | 2015 | Total | % |
|---|---|---|---|---|---|---|---|---|
| Total | 17.30 | 19.01 | 21.33 | 22.13 | 24.31 | 27.03 | 131.10 | 100.00 |
| Elsevier | 6.41 | 6.84 | 7.38 | 7.65 | 8.10 | 8.58 | 44.96 | 34.30 |
| Wiley | 1.66 | 2.06 | 2.29 | 2.43 | 2.57 | 2.65 | 13.67 | 10.43 |
| Ebsco | 0.81 | 1.76 | 1.97 | 2.09 | 2.00 | 1.70 | 10.33 | 7.88 |
| Springer | 1.30 | 1.36 | 1.41 | 1.45 | 1.48 | 1.50 | 8.49 | 6.48 |
| ProQuest | 0.75 | 0.83 | 0.97 | 0.98 | 1.01 | 1.24 | 5.77 | 4.40 |
| Thomson Reuters | 0.49 | 0.54 | 0.67 | 0.73 | 0.77 | 0.94 | 4.13 | 3.15 |
| SAGE Publications | 0.50 | 0.55 | 0.65 | 0.66 | 0.71 | 0.86 | 3.92 | 2.99 |
| American Chemical Society (ACS) | 0.51 | 0.53 | 0.59 | 0.62 | 0.63 | 0.78 | 3.66 | 2.79 |
| Nature Publishing Group | 0.38 | 0.42 | 0.58 | 0.64 | 0.67 | 0.62 | 3.30 | 2.52 |
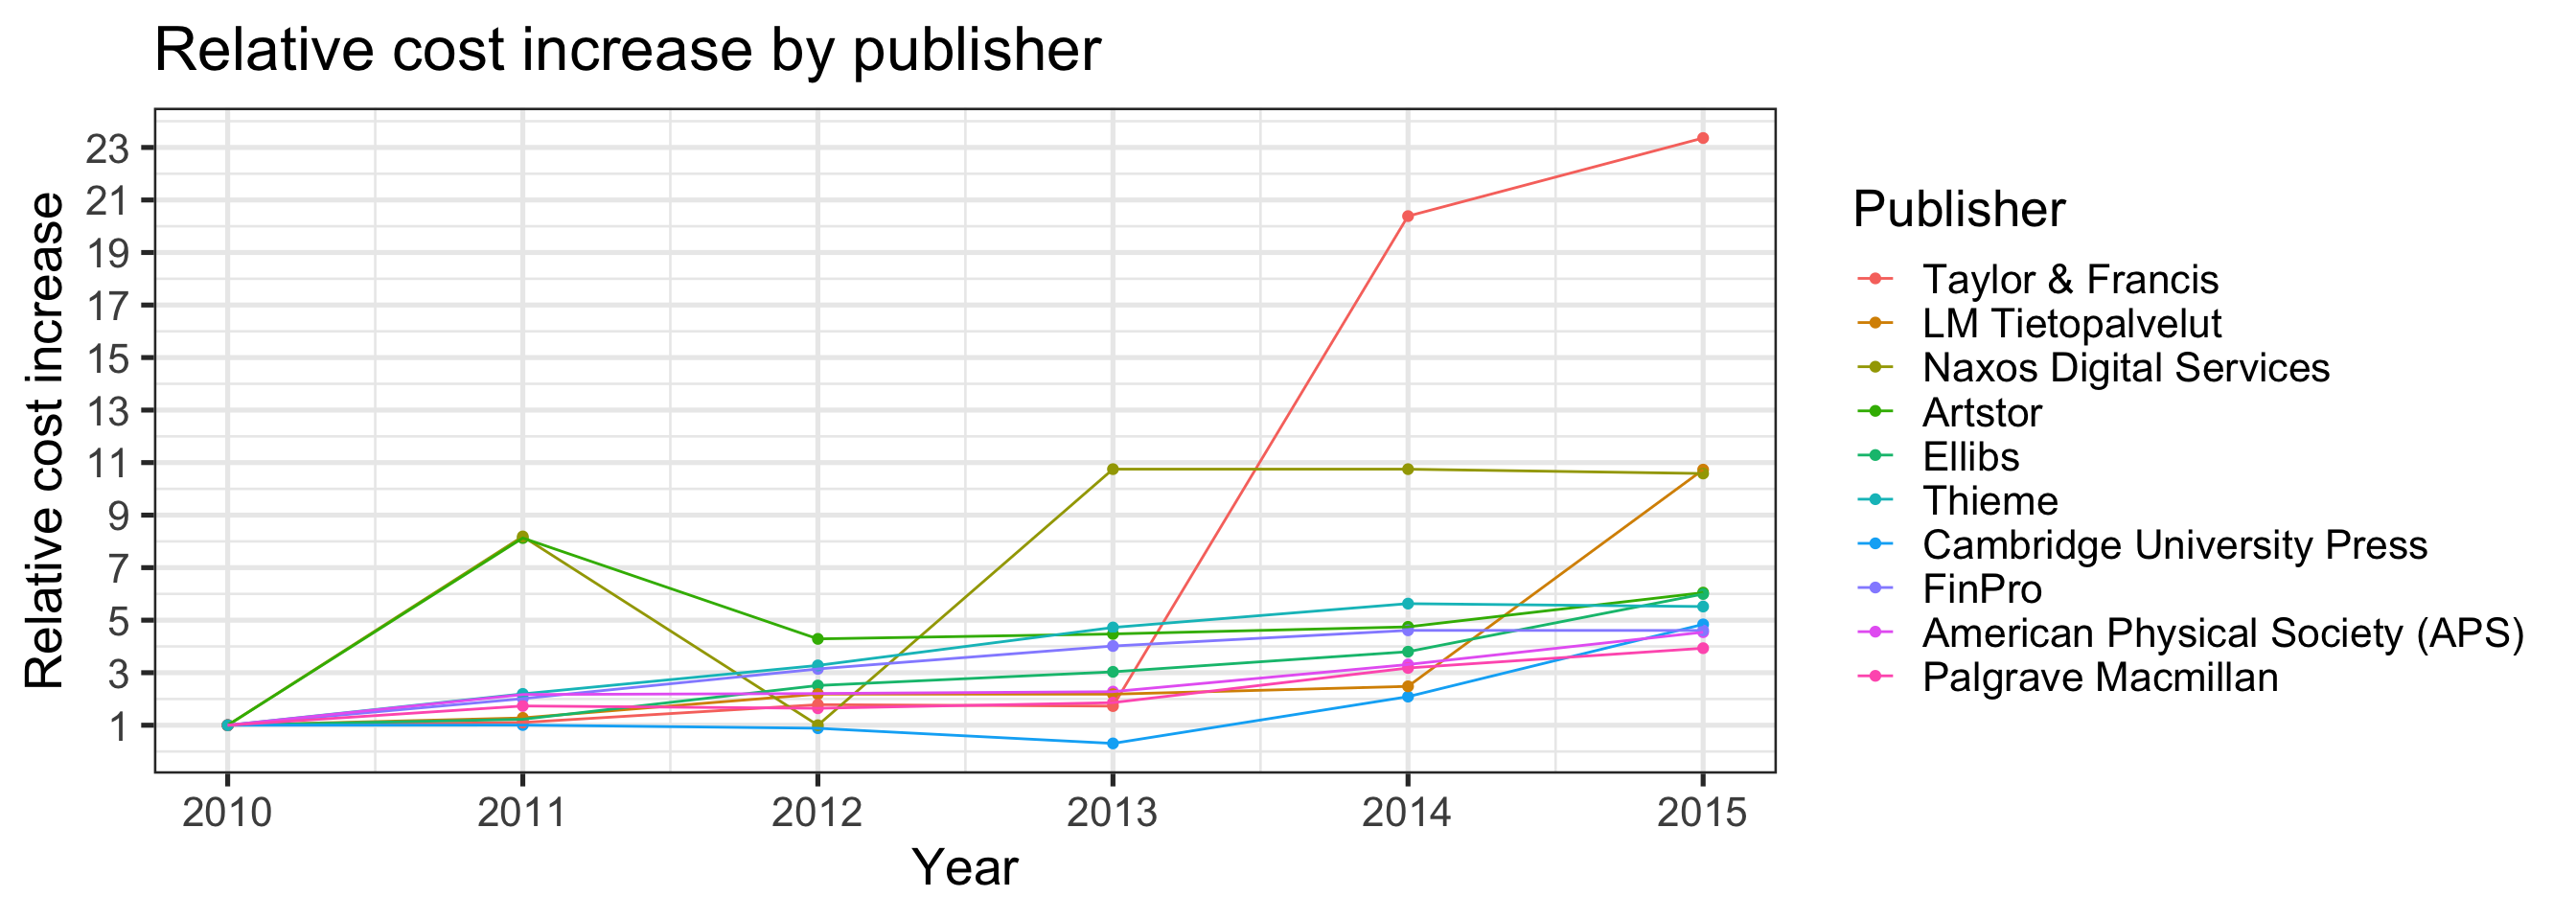
Let us compare the relative increase in publisher costs. The costs are normalized to 1 in 2010, and the top 10 publishers with the highest cost increase in 2010-2015 are shown. The 120 publishers that did not have declared costs in 2010 or 2015 (see here) are excluded.
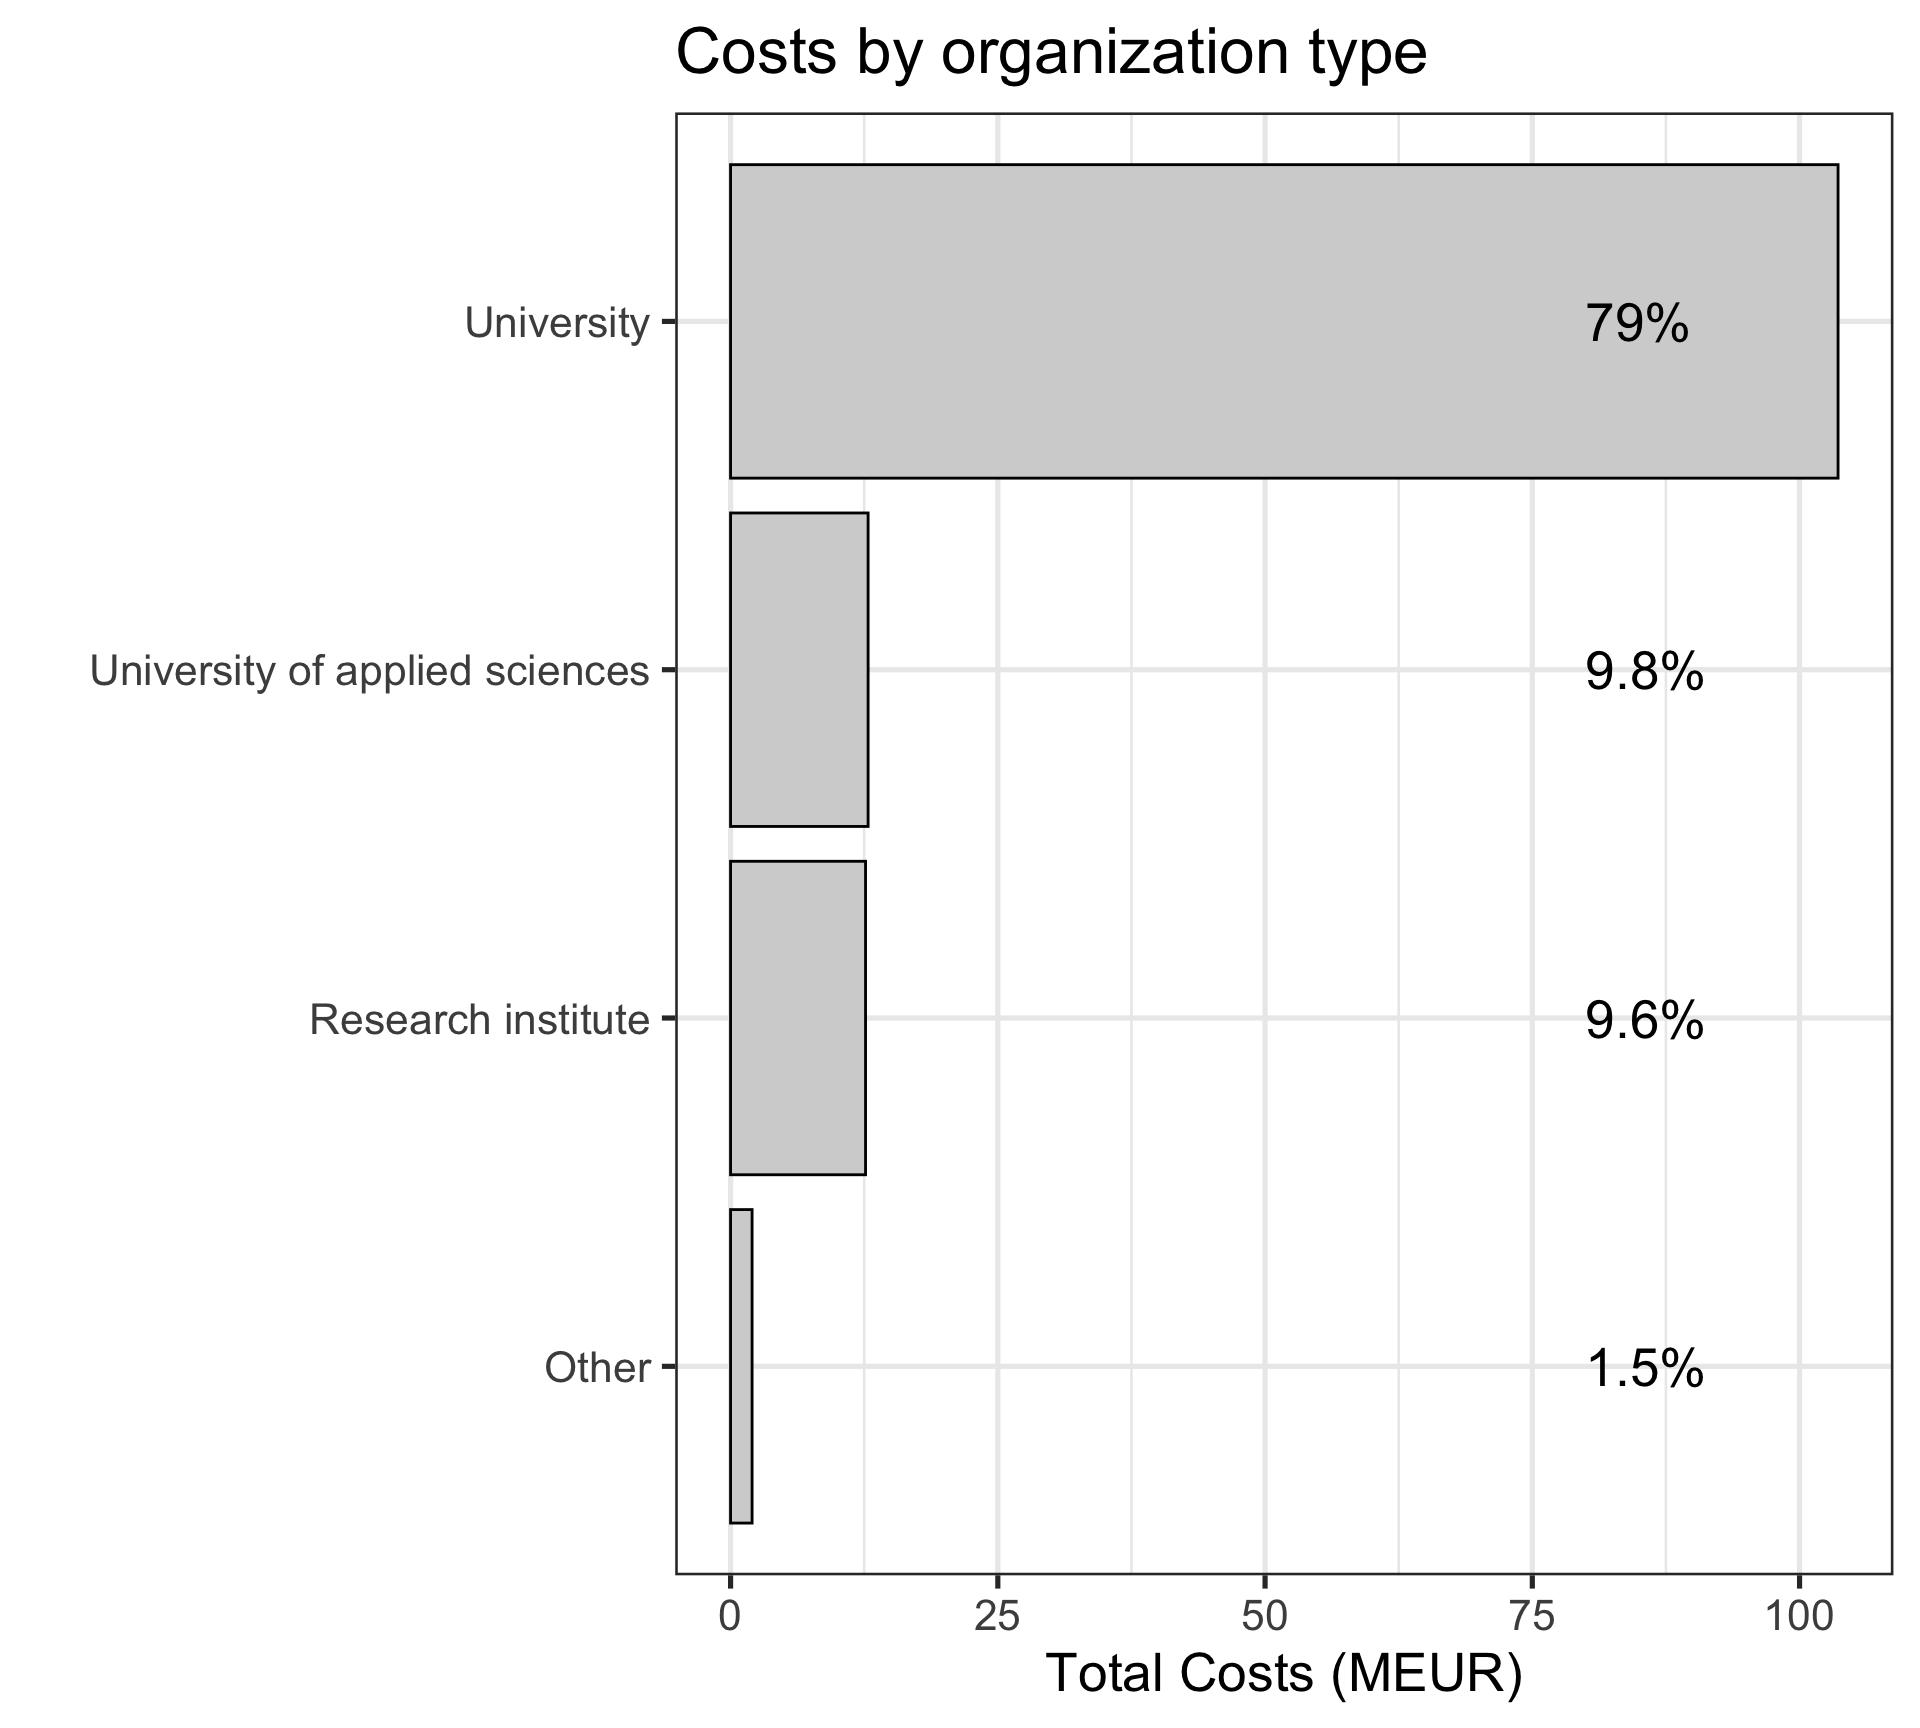
Costs by organization
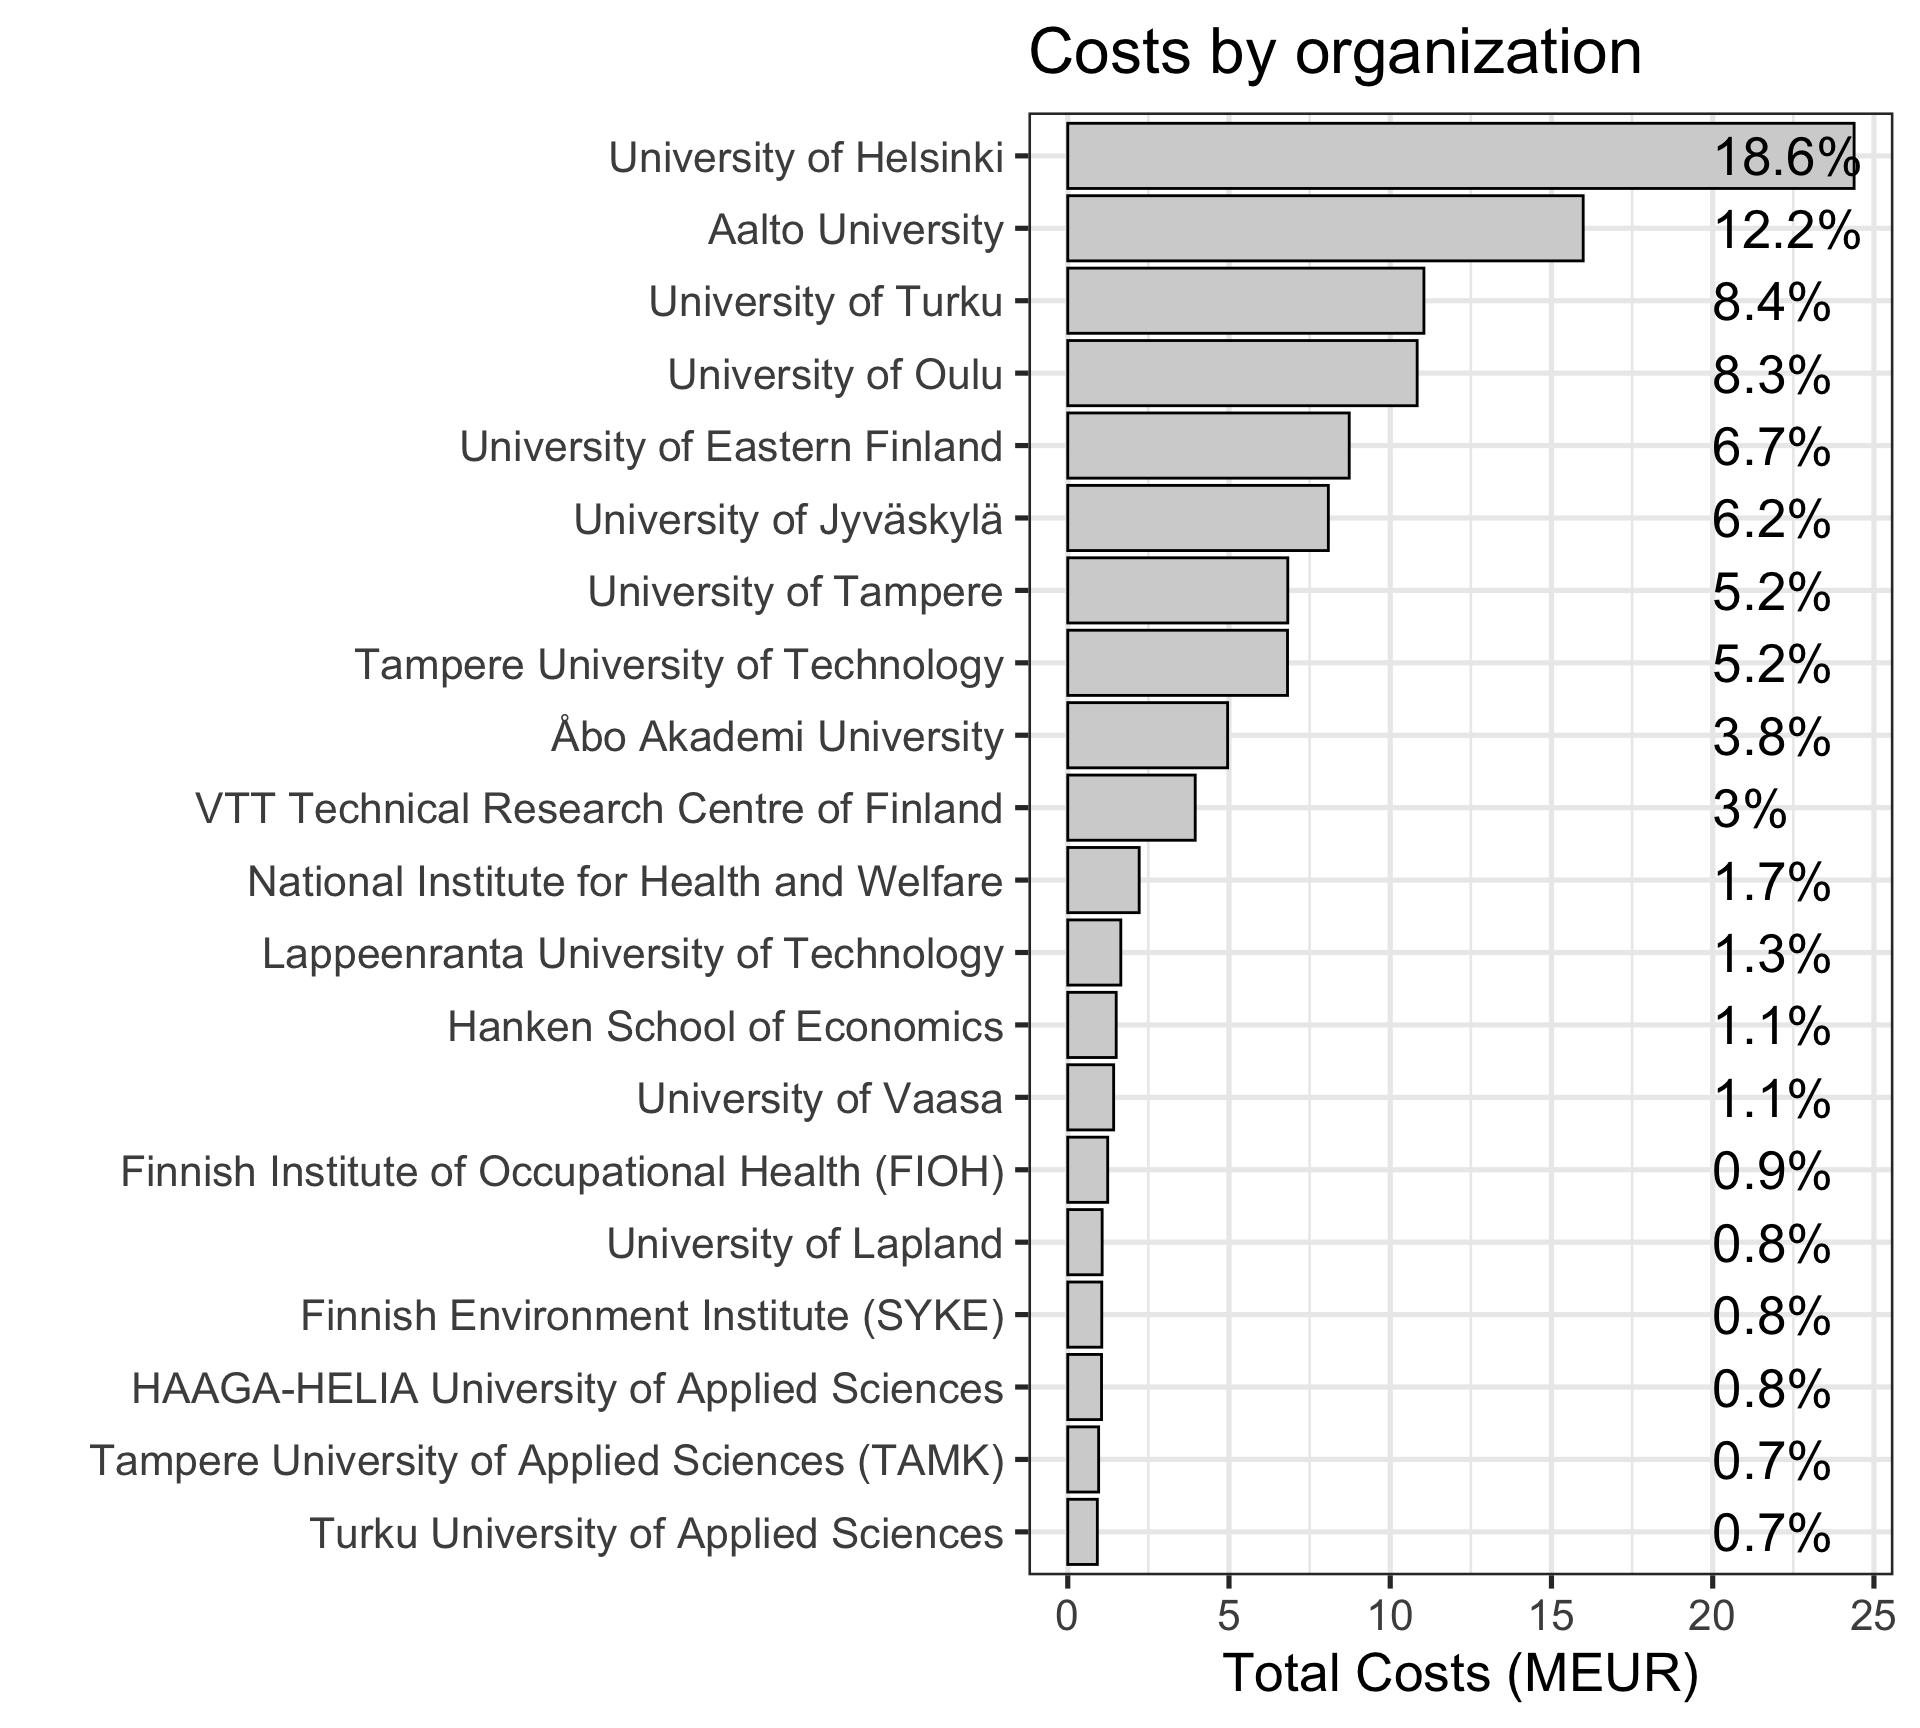
The Finnish data collection includes 63 organizations (see annual costs by organization). The universities (‘yliopisto’) are responsible of 79% of all costs (left figure); University of Helsinki had the highest total costs in 2010-2015 (24.4 MEUR; top institutions shown in the right figure). The Table indicates the annual costs for the top organizations.
| Organization (costs in MEUR) | 2010 | 2011 | 2012 | 2013 | 2014 | 2015 | Total | % |
|---|---|---|---|---|---|---|---|---|
| Total | 17.30 | 19.01 | 21.33 | 22.13 | 24.31 | 27.03 | 131.10 | 100.00 |
| University of Helsinki | 3.32 | 3.52 | 3.91 | 4.12 | 4.46 | 5.05 | 24.39 | 18.60 |
| Aalto University | 2.25 | 2.40 | 2.67 | 2.71 | 2.88 | 3.07 | 15.98 | 12.19 |
| University of Turku | 1.50 | 1.60 | 1.76 | 1.79 | 2.04 | 2.35 | 11.04 | 8.42 |
| University of Oulu | 1.49 | 1.57 | 1.74 | 1.83 | 2.03 | 2.17 | 10.84 | 8.26 |
| University of Eastern Finland | 0.90 | 1.35 | 1.43 | 1.53 | 1.69 | 1.82 | 8.73 | 6.66 |
| University of Jyväskylä | 1.07 | 1.14 | 1.27 | 1.31 | 1.57 | 1.73 | 8.08 | 6.16 |
| University of Tampere | 0.91 | 1.00 | 1.09 | 1.14 | 1.28 | 1.41 | 6.82 | 5.20 |
| Tampere University of Technology | 0.90 | 1.05 | 1.17 | 1.19 | 1.21 | 1.30 | 6.82 | 5.20 |
| Åbo Akademi University | 0.75 | 0.78 | 0.79 | 0.78 | 0.89 | 0.97 | 4.96 | 3.78 |
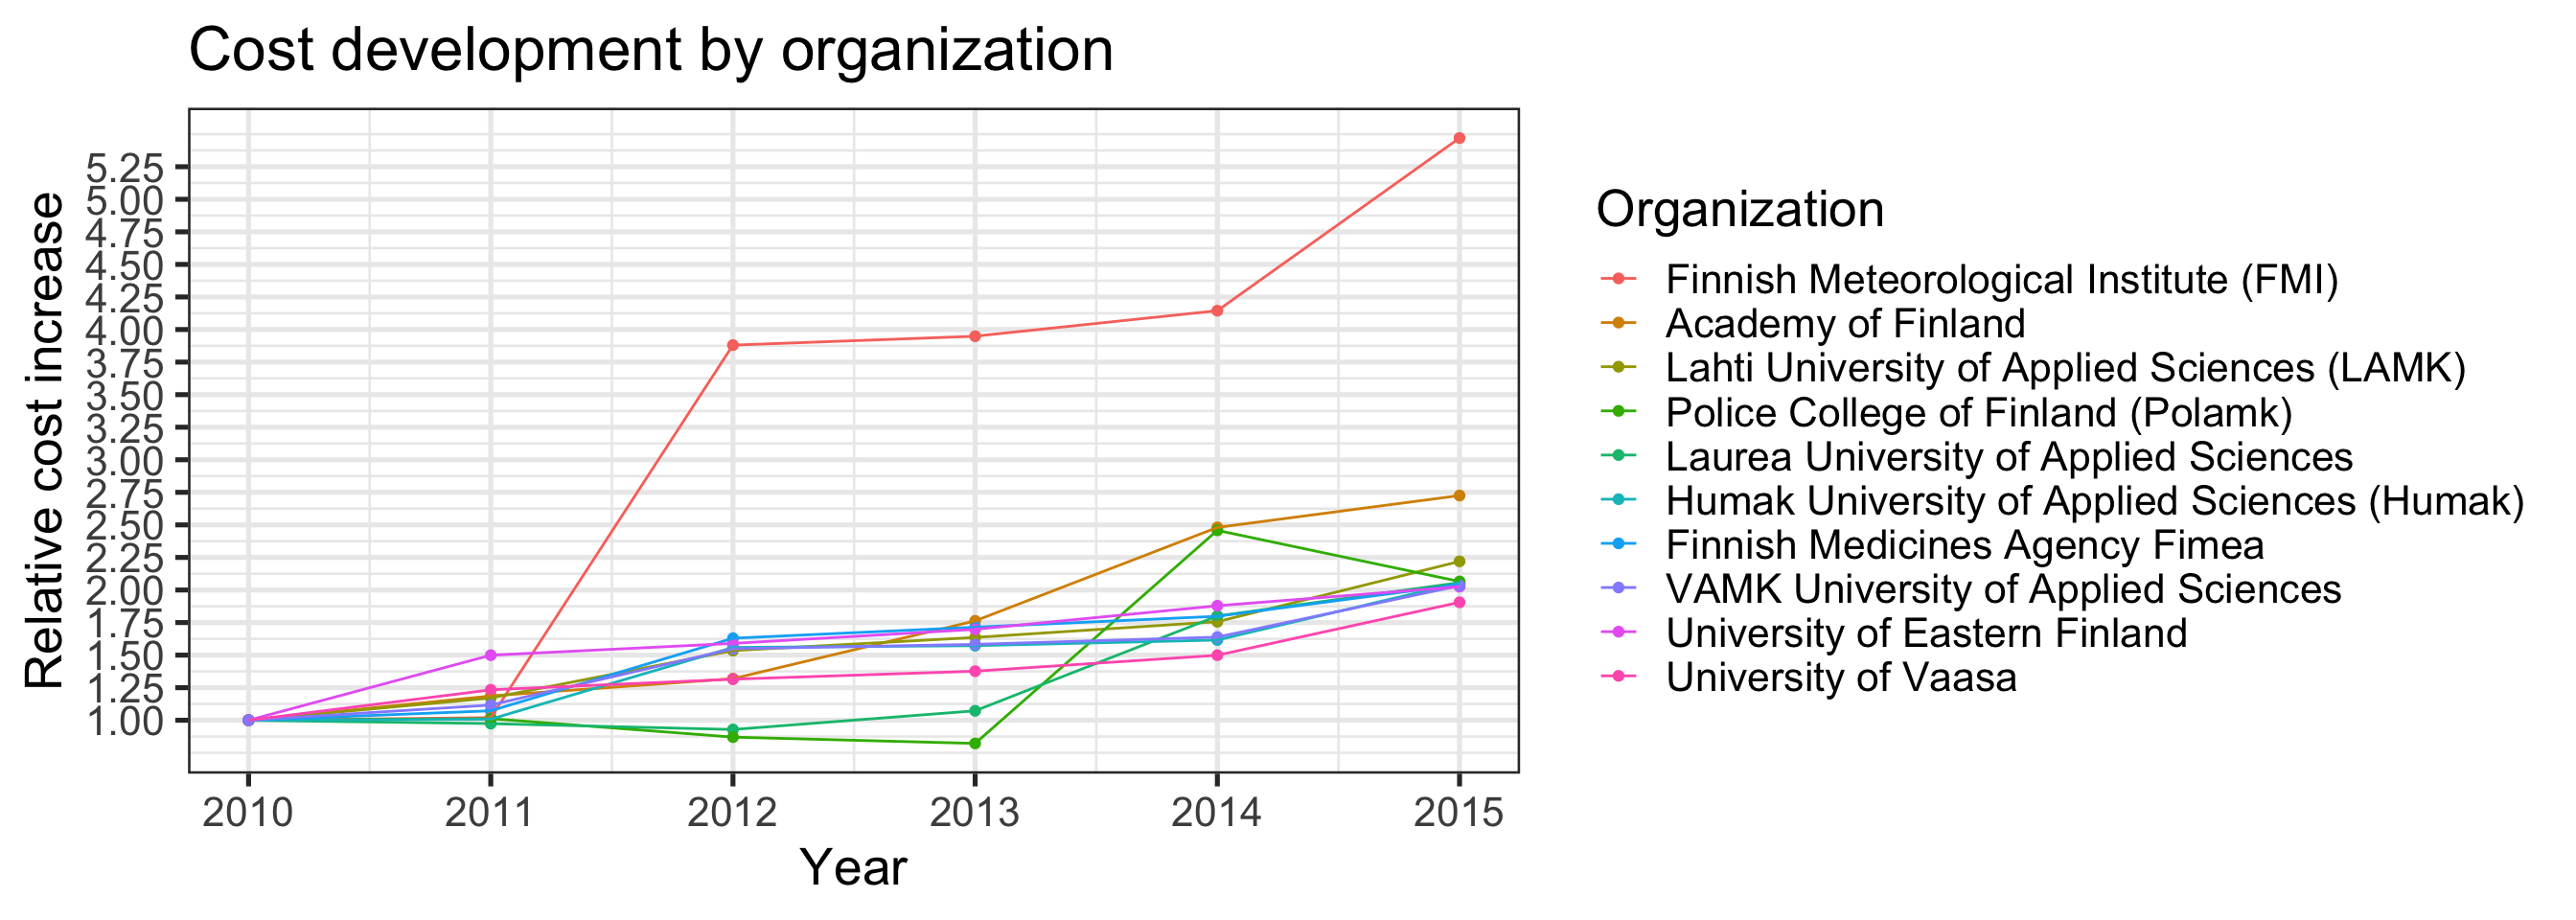
Finally, let us compare the relative increase in costs across the institutions. The costs are normalized to 1 in 2010, and the top 10 organizations with the highest cost increase in 2010-2015 are shown. The 12 organizations that did not have declared costs in 2010 or 2015 (see here) are excluded.